


The Journey is your builder’s reference library. Crack open the full archive here → https://6catalysts.substack.com/archive

Good businesses talk to their customers. Great businesses listen to their customers. Exceptional businesses put their customers’ wants and needs at the centre of their operations.
Let’s talk about how to do that.
The Paradox of Success
This is a topic that I think about frequently, and with depth. To keep this post on The Journey focused on actionable learnings, I opted to forego adding a lengthy discussion about what I call the paradox of success to this post. If you’re interested in a deeper dive on that context piece, check out my companion post “The Paradox of Success” on Medium : The Paradox of Success : Why Customers Fall Out of Love With Growing Brands.
But for here, the TL;DR—
As the business finds success and begins to grow, it loses sight of how it became successful in the first place, because it stops proactively seeking customer feedback. And, is then less able to replicate that early success when the initial shine wears off.
Fighting Back with a Scalable Feedback Engine
As your business grows, you’ll naturally have less time and mental presence to really engage with customers proactively. Putting in place the tool stack, processes, and designating a champion to really solidify the voice of the customer within the action zones of your organization is a necessary part of continuously fostering innovation.
I call that intentional combination of stack, process, and person the Scalable Feedback Engine.
Designing Your Scalable Feedback Engine
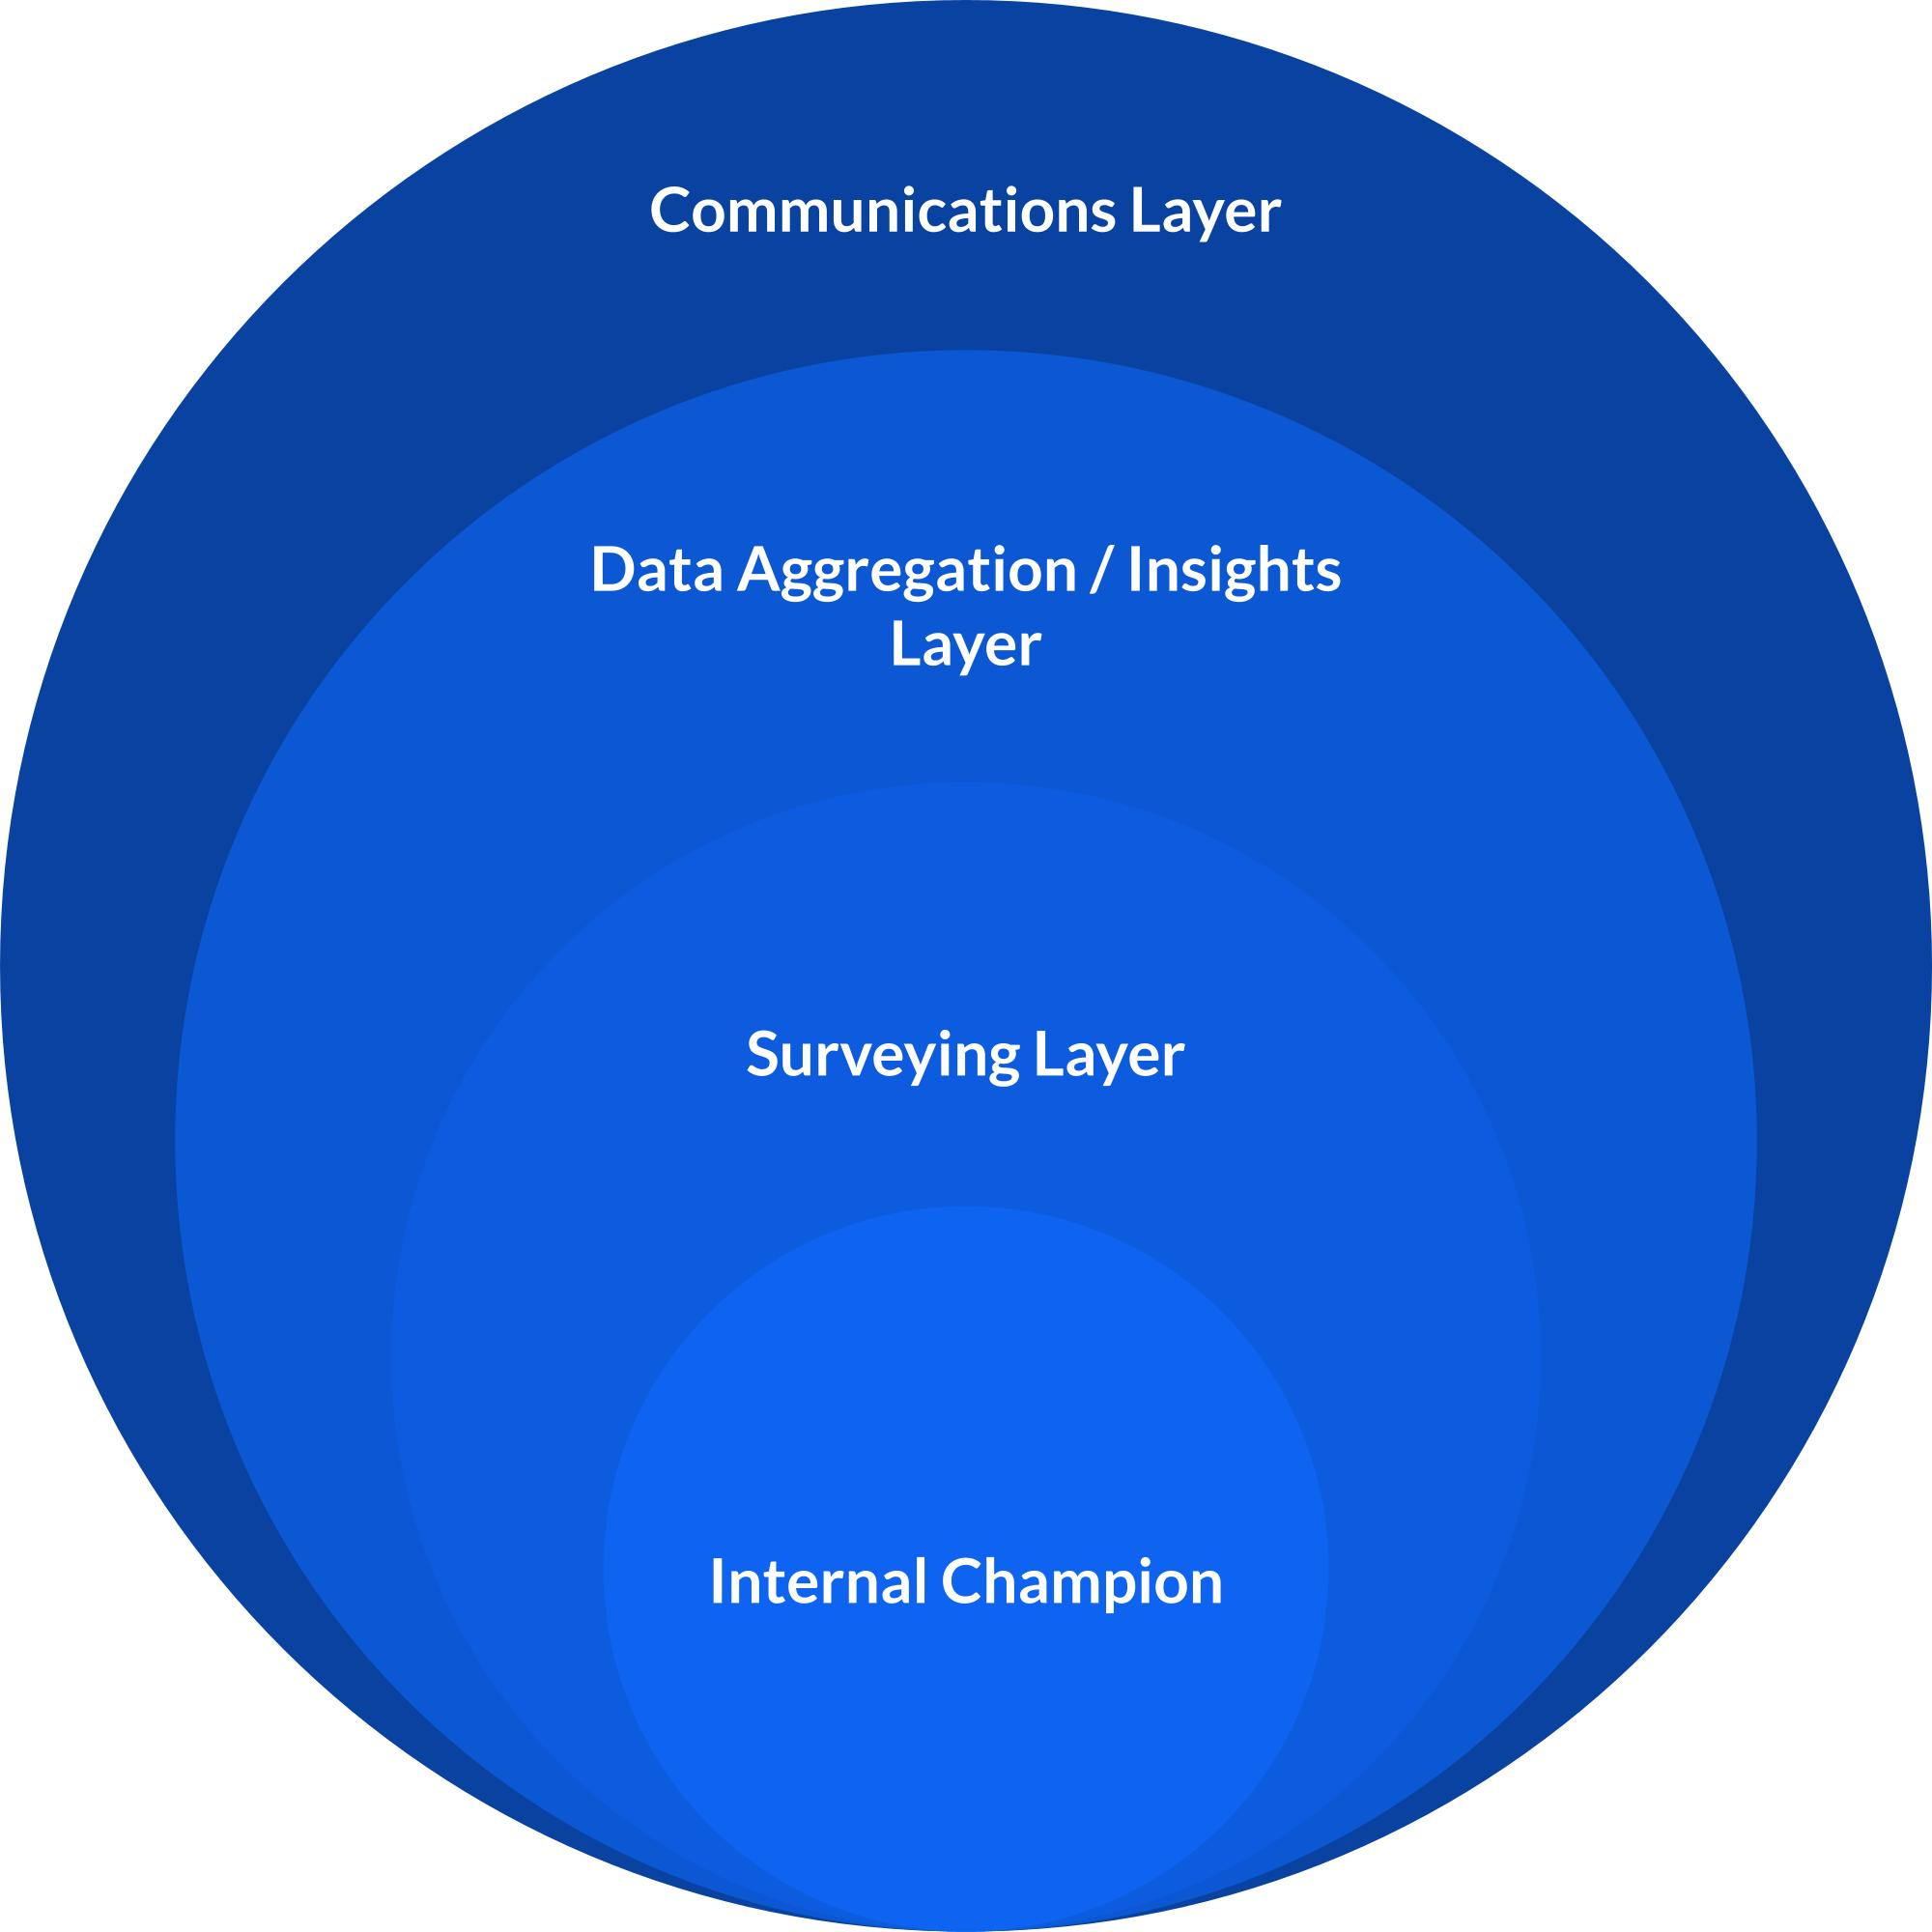
A technology and process stack that’s going to support your Scalable Feedback Engine has a few different components that need to work together—
An internal champion : a person who acts as a bridge between the research activities and different key people in your organization—the champion takes the insights and promotes them throughout the business. Without a champion, research programs will often fail to be a catalyst for continuous innovation.
A surveying layer : the thing that you use to ask questions and gather feedback from customers.
A data aggregation layer : the thing that you use to aggregate and analyze data as you search for insights buried within what your customers tell you.
An insights layer : the thing that you use to clarify the insights and communicate them to various stakeholders who are connected to the business (inside and out).
A communications layer : the thing(s) that you use to communicate with customers, and solicit their participation in your research.
Use Case
Sylvie (the champion) creates an email campaign in Brevo (the communications layer) asking customers to complete a survey that she’s created on Google Forms (the surveying layer) for a chance to win a free widget. When the campaign is sent and the surveys completed, she segments and analyzes the data in Google Sheets (the data aggregation layer). She then prepares a presentation of what she learned from the responses, carefully outlining the actionable opportunities for different stakeholders, in an Office 365 PowerPoint deck (the insights layer). She sends the deck to the people who are directly connected to the insights she distilled, and curates discussions and meetings with them to disseminate the learnings.
By doing so, Sylvie is acting as a staunch voice of the customer and contributing to the innovation ecosystem within the company.
The Research Stack
The “Research Stack” (tool stack) is a critical part of the scalable part of the feedback engine. In order to control the costs of running this program in a way that works for your business, intelligently leveraging automation is an absolute must. The more time that your champion spends on repetitive tasks, the less time they spend distilling insights and delivering those to the key stakeholders through their advocacy.
When evaluating different systems for use in the stack’s layers, you’ll notice that many tools serve multiple layers. That’s fine—use what works, but make sure each function is covered intentionally.
Tools for the Communication Layer
Ideally, you’d make use of your existing communications tools that you use to market to your customers. If you already have an email marketing platform, use it. If not, look for one that supports integrations to the services that your customers use : email, rcs/sms texting, WhatsApp, and Facebook Messenger are all examples.
An important part of your communications layer is creating list segmentation and soliciting contact permission with customers so that you’re complying with regulations like GDPR (EU), CANSPAM (USA), and CASL (Canada). The basic spirit of this is to ask permission to contact customers to collect feedback, and then add those customers to a list which is only ever used for this purpose. Never, ever, send purely commercial / marketing messages to this list.
That’s not to say that you can’t get some marketing value from it though—if you’re smart about it, you can include rewards or special offers that generate future revenue as a part of the research activities.
Some commonly-used systems :
MailChimp (Email, SMS, API, social media)
Brevo (Email, SMS, WhatsApp, API)
Klaviyo (Email, SMS, API)
Amazon SES (Email)
Twilio SendGrid (Email, SMS, API)
Zoho Campaigns (Email, SMS, API)
This isn’t an exhaustive list, there are easily dozens or hundreds of competing services in this space. If you’re sourcing a new tool for communications, look for one that includes email and SMS as a part of the core platform, with integrations or an API that can be used to extend how you communicate with customers as you grow. I also find webhooks extremely useful as you build. Most importantly—model the costs of the different systems you’re considering before making a decision (especially in cases where the pricing model is heavily based on both the number of contacts you have and the volume of messages you send—this dual node pricing model gets very expensive as you scale).
Tools for the Surveying Layer
For the surveying layer, you’ll want a system which allows you to build feedback surveys aggregate results in context (in other words, shows you the results alongside the questions as customers complete the feedback form).
This can be as simple as Google Forms / Microsoft Forms, it can be a more robust hosted solution, or it can be a self-hosted solution for your own website. The simplest to deploy and use are the former (though you may outgrow them quickly) while the more complicated systems (and most flexible) tend to be the ones which you self-host on your own website or applications.
Common Simple Tools :
Common Hosted Solutions :
Common Self-Hosted Solutions :
Gravity Forms (WordPress only, plugin)
Tools for the Data Aggregation Layer
Tools for aggregating and analyzing data can be as simple as dumping out the raw data to analyze with Excel or Google Sheets. They can also include complex graphing solutions like those found in Tableau, Microsoft Power BI (Business Intelligence), Qlik, and Looker (now called Google Looker Studio).
Personally, I find that tools which combine “good enough” data analysis with “good enough” graphing and visualization are often the best choice when you’re starting out. My go-to for basic analysis tends to be Google Sheets + Google Looker Studio.
Commonly-Used Simple(r) Tools :
Commonly-Used Advanced Tools :
Tools for the Insights Layer
The primary tool for generating insights from your research activities is the human brain. Augmentation with an AI system can sometimes be useful, but it’s important not to solely rely on AI to generate insights—a human is always needed to filter and moderate the AI’s output into something useful.
So really, the insights layer is about using tools to help effectively communicate the results of research activities and (most importantly) the insights which the people brains have constructed from them. Enter, the dreaded PowerPoint deck (thankfully, there’s lots of choice in how you communicate and what you use for that).
Commonly-Used Tools :
A Note on Automation and Data Transport
Managing a stack with multiple systems can be a drag on your productive time which could otherwise be used for generating insights. That’s why I tend to look for interoperabilities with systems when I’m building a stack (does system A in the surveying layer already have an integration with system B in the data aggregation layer?).
Employing automation pipelines can also be an effective way to cut down on the amount of manual, repetitive work that needs to be done to transport information between systems and aggregate data.
Some commonly used tools for automated data transport :
IFTTT (If This Then That)
Microsoft Power Automate (limited use outside of the Microsoft ecosystem, but fantastic if most of your systems are from Microsoft—especially if you use MS Teams)
What Questions do I Ask?
It depends (like most things).
Service-driven brands will often find value in measuring how satisfied customers are with the experience of doing business with them, and their perception of the brand itself. Net Promoter Score (NPS) and Customer Satisfaction Score (CSAT) are common approaches for this type of measurement. NPS in particular is a very high-level metric, and doesn’t give much granular detail on what customers think and feel about their interactions with the business—so it’s most useful as a simple, long-term measurement to benchmark with, where other activities get to the heart of collecting actionable feedback.
Net Promoter Score (NPS)
A typical question :
On a scale of 0 to 10 (where 10 is the highest), how likely are you to recommend [Brand]?
The brand then subtracts the percentage of brand detractors from the percentage of brand promoters to arrive at a score of -100 to 100.
It works like this :
Anyone who responds with a 0 - 6 is considered a detractor
Anyone who responds with a 7 or 8 is considered passive, and excluded
Anyone who responds with a 9 or 10 is considered a promoter
So, if 100 people are surveyed and :
20 respond with a score of 0 - 6 (detractors)
40 respond with a score of 7 - 8 (passives)
40 respond with a score of 9 - 10 (promoters)
Then the NPS is 40 - 20 = +20.
The system is designed to measure and standardize a scoring for sentiment, and links that score to the fundamental assumption that a positive net promoter score will create a tailwind for organic growth (loyal customers are often repeat customers, and share positive word-of-mouth). Conversely, a negative net promoter score will create a headwind for organic growth (unhappy customers tend to be very vocal, which can deter new customers from considering a brand).
Here’s a live example of an NPS survey for a fictitious artisanal coffee roasting brand :
Customer Satisfaction Score (CSAT)
A typical question :
Based on your last purchase from [Brand], how likely are you to make another purchase in the future?
It’s quite common for the accepted response to be strictly structured using a Likert scale where the respondent would choose a single answer from a list, like so :
Very Likely
Likely
Neither Likely nor Unlikely *
Unlikely
Very Unlikely
This scale infers a scale of satisfaction ranging from positive, through neutral, through negative with distinctions between strong and mild favour or disfavour. Some researchers remove the neutral ranking to deter “fence-sitting”. I’m usually in this camp when I conduct CSAT research, I find neutral ratings of satisfaction rather useless—they tend to water down the implications of both high and low satisfaction.
After the results of questions like this are tallied, they’re usually expressed as a percentage of the most dominant rankings.
For instance :
84% of respondents indicated that they were likely or very likely to make another purchase from [Brand] in the future.
Avoiding Bias
CSAT can be applied more broadly in research than NPS, and can be adapted to a number of different topics or questions. Since CSAT inquisition is less structured than NPS, you need to be very careful to avoid introducing bias through your questions.
For example :
❌ Don’t ask —> “If you’re a smart millennial, how likely are you to love our product?”
✅ Do ask —> “How likely are you to purchase from [Brand] again?”
It’s a bit of a blend of art and science to avoid introducing bias through your survey design and how you communicate with customers. In general, use neutral language and tone extensively—and rely on consistency in the options for your rating scales. Though it’s not as engaging as creative copywriting or as fun to write—bland, boring questions are an important part of reducing bias (and giving you more truthful feedback to work with).
Here’s a live example of a CSAT survey for a fictitious artisanal coffee roasting brand :
Wait, What About Products?
Product-driven brands often find significant value in understanding how customers feel about a given product experience, how well it met their expectations, and to uncover what unmet needs a customer might have (“use cases”). For this type of feedback, I developed a variant framework of CSAT called Product Satisfaction Score (PSAT) which I use to measure satisfaction with product-centric experiences.
More on that in a future post, but in general, when you take the opportunity to focus on products in your customer research, ask questions about how the customer used the product and how it performed compared to their expectations. Also ask questions about them, and their everyday behaviours.
Here’s a live example of a PSAT survey for a fictitious artisanal coffee roasting brand :
From Stack to Scalable Feedback Engine
The stack of tools which you use for research is only one part of the equation. Your stack should be flexible, robust, and include features which reduce the amount of manual work needed to aggregate and analyze your responses.
What transforms a research stack into a true feedback engine for the business is the process through which the insights are transported to the different stakeholders and the tenacity of the champion who has ownership of this function.
And, process.
Not the kind of process that’s a to-do list of things, just because.
The kind of process that creates a system in motion which supports people.
Creating a supportive process framework to operate your Scalable Feedback Engine will be a different journey for every business, but the guiding question to ask and answer is :
How can I most effectively communicate these insights to the right people, while making the best use of their time?
The process for your business will flow from the answer to this question.
Sometimes, the champion will settle on an ad-hoc approach where they make face time with stakeholders as needed.
Sometimes, the champion will settle on a scheduled series of meetings to present research findings and insights to a set stakeholder group.
Sometimes, the champion will settle on a system of asynchronous updates using dashboards and presentations that can be communicated through your internal messaging system.
Sometimes, a blend of all three.
This is another purpose for having a champion in place to run the engine and advocate for the customer inside your organization—they’ll be able to calibrate the internal communications approach based on what’s working and what’s not working. And, they’ll be able to receive feedback from stakeholders and adapt.
Feedback
Improving The Journey is a journey in itself—and I’d love your help. Share your anonymous feedback here : https://6catalysts.ca/subscribe/the-journey-feedback/


Share this post